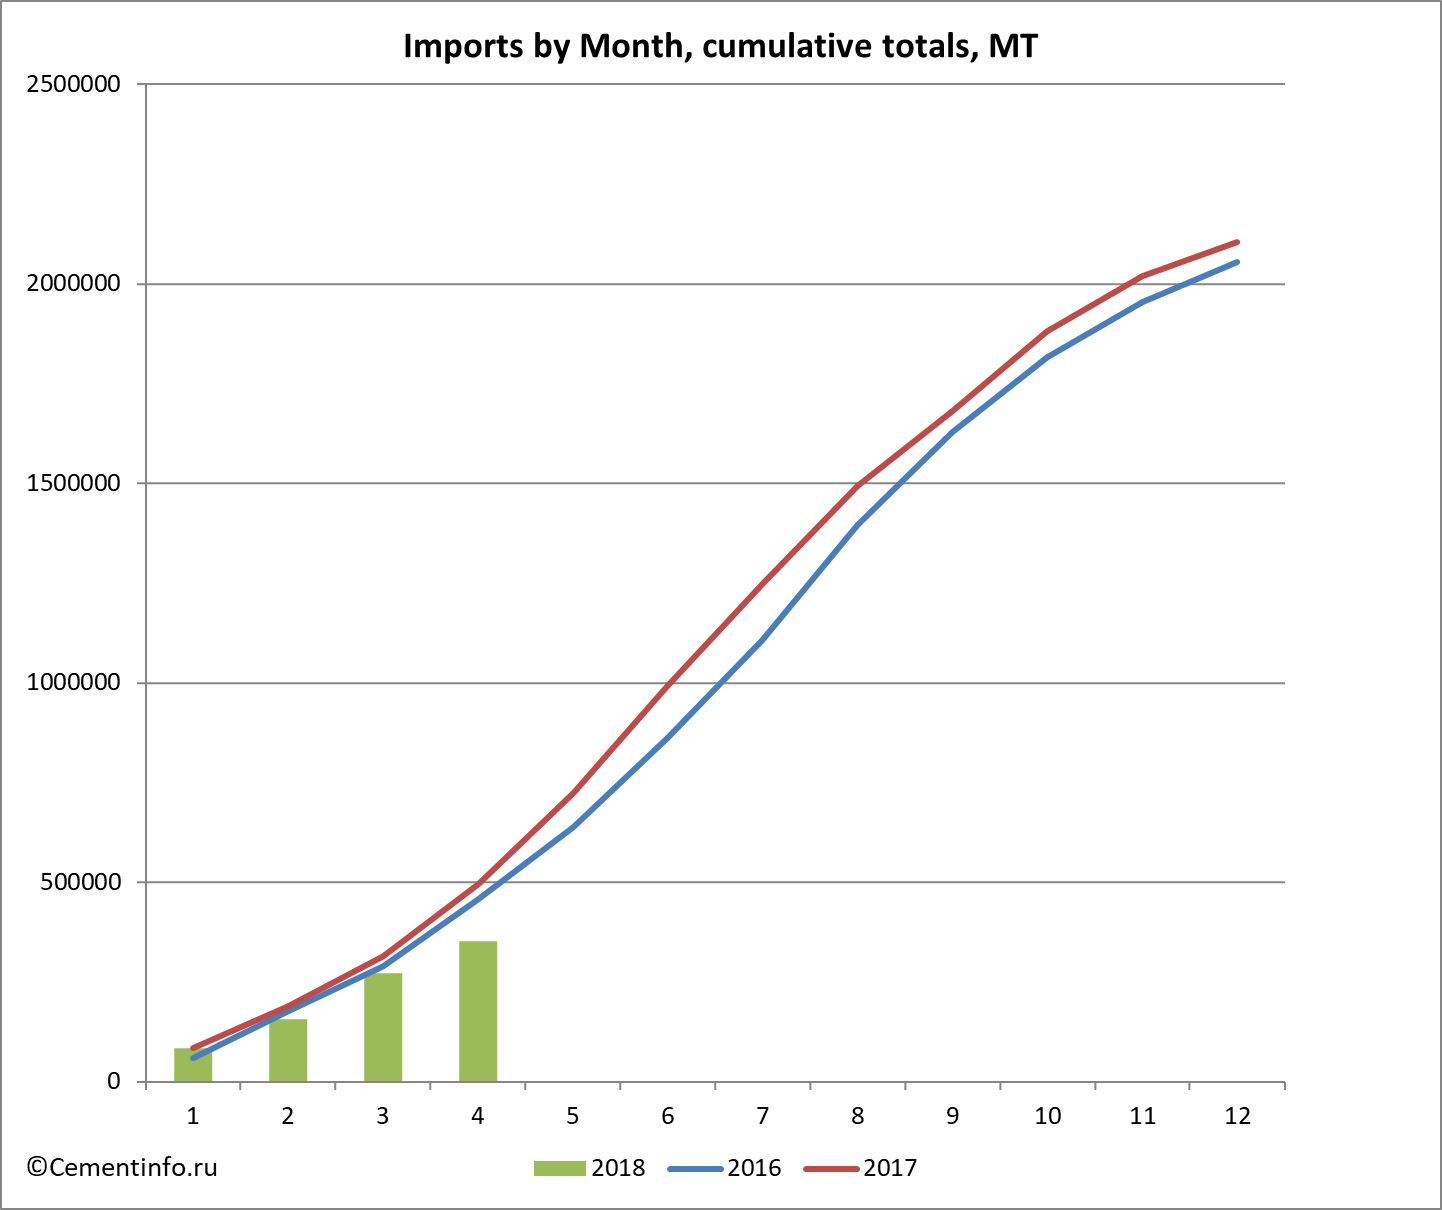
According to the analysis of customs declarations of FCS conducted by Cementinfo.ru, in April 2018 Russia has imported 82.0 thousand tons of cement. According to the results of 4 months of cement import campaign, Russia has shipped in 353.5 thousand tons (in 2017 - 495.5 thousand MT; in 2016 - 457.7 thousand MT).
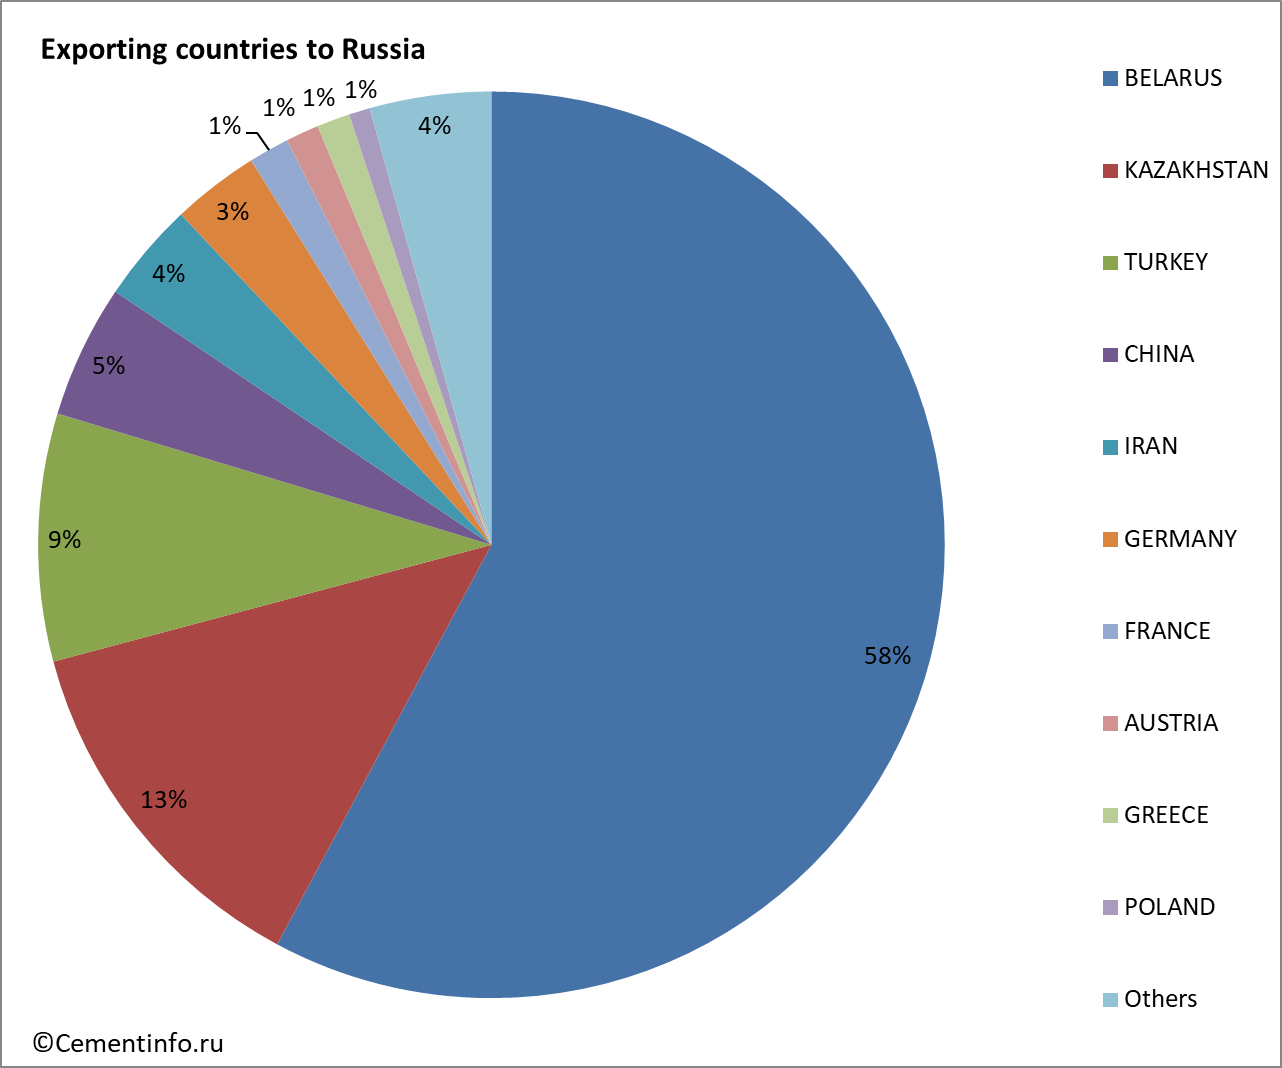
In the period January - April 2018, the main countries exporters of cement to Russia were BELARUS (57.83%) and KAZAKHSTAN (13.02%).
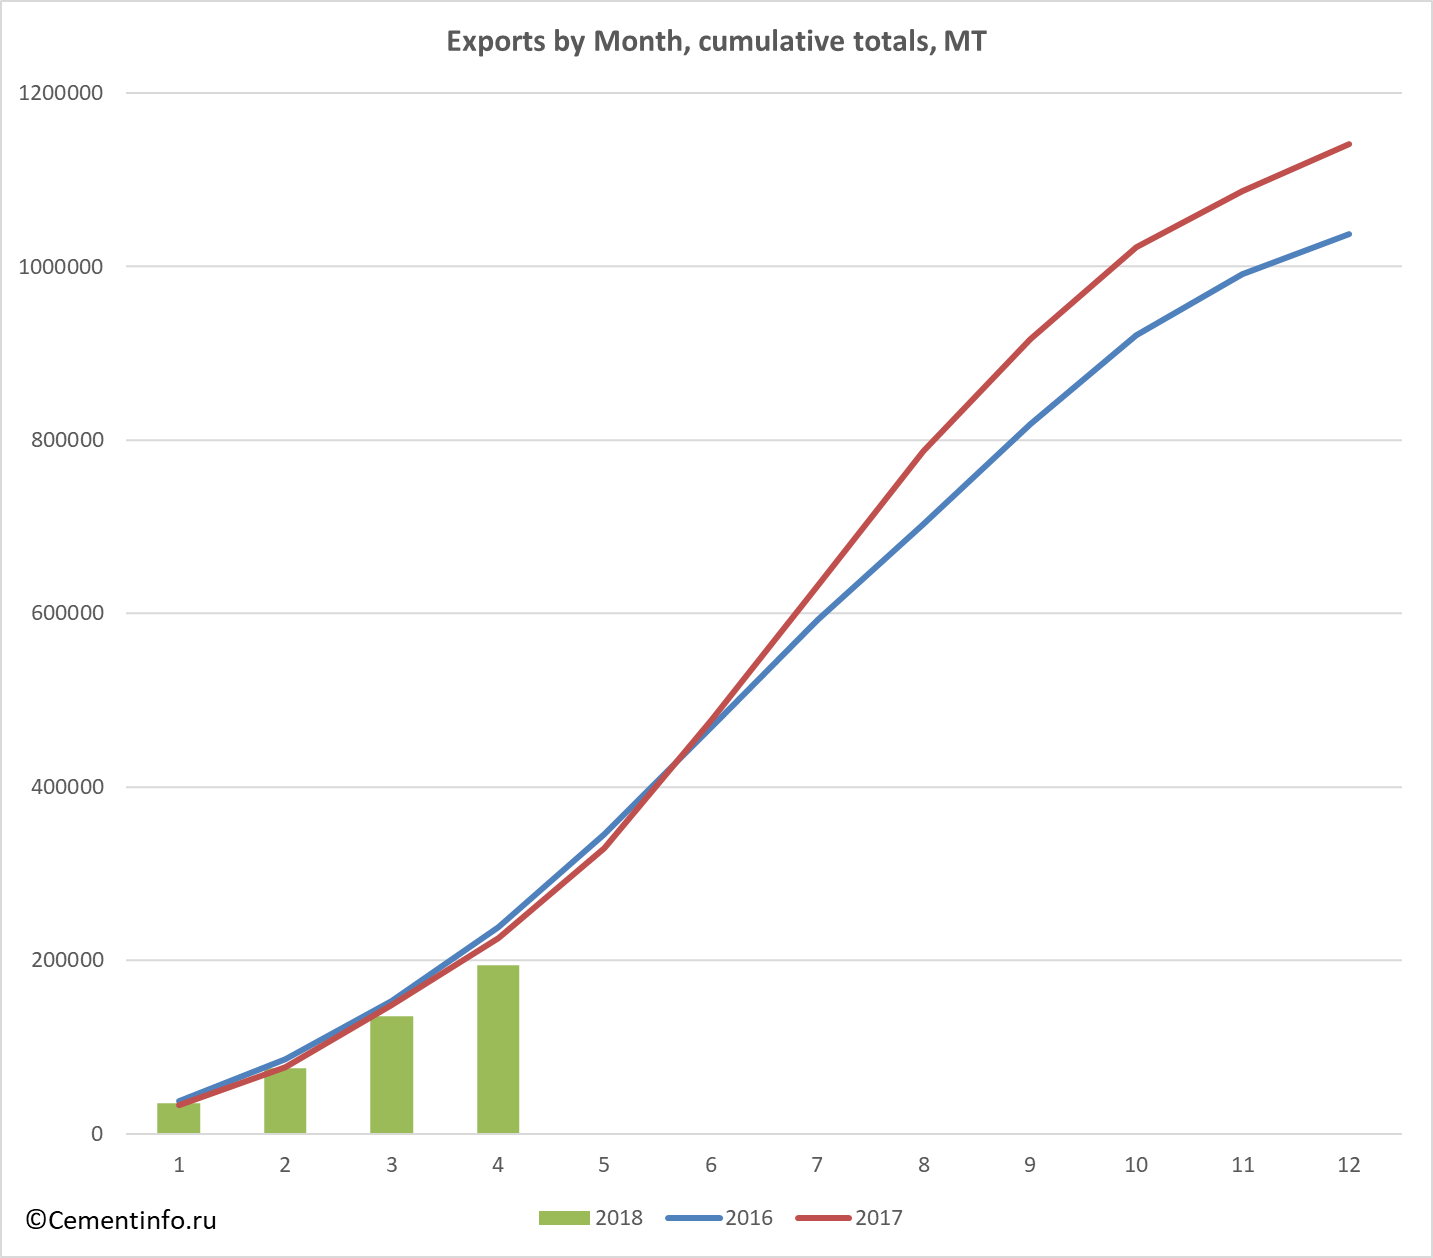
In April 2018 Russia has exported 194.6 thousand tons of cement. According to the results of 4 months of cement export campaign, Russia has shipped out 194.6 thousand tons (in 2017 - 225.3 thousand MT; in 2016 - 238.7 thousand MT).
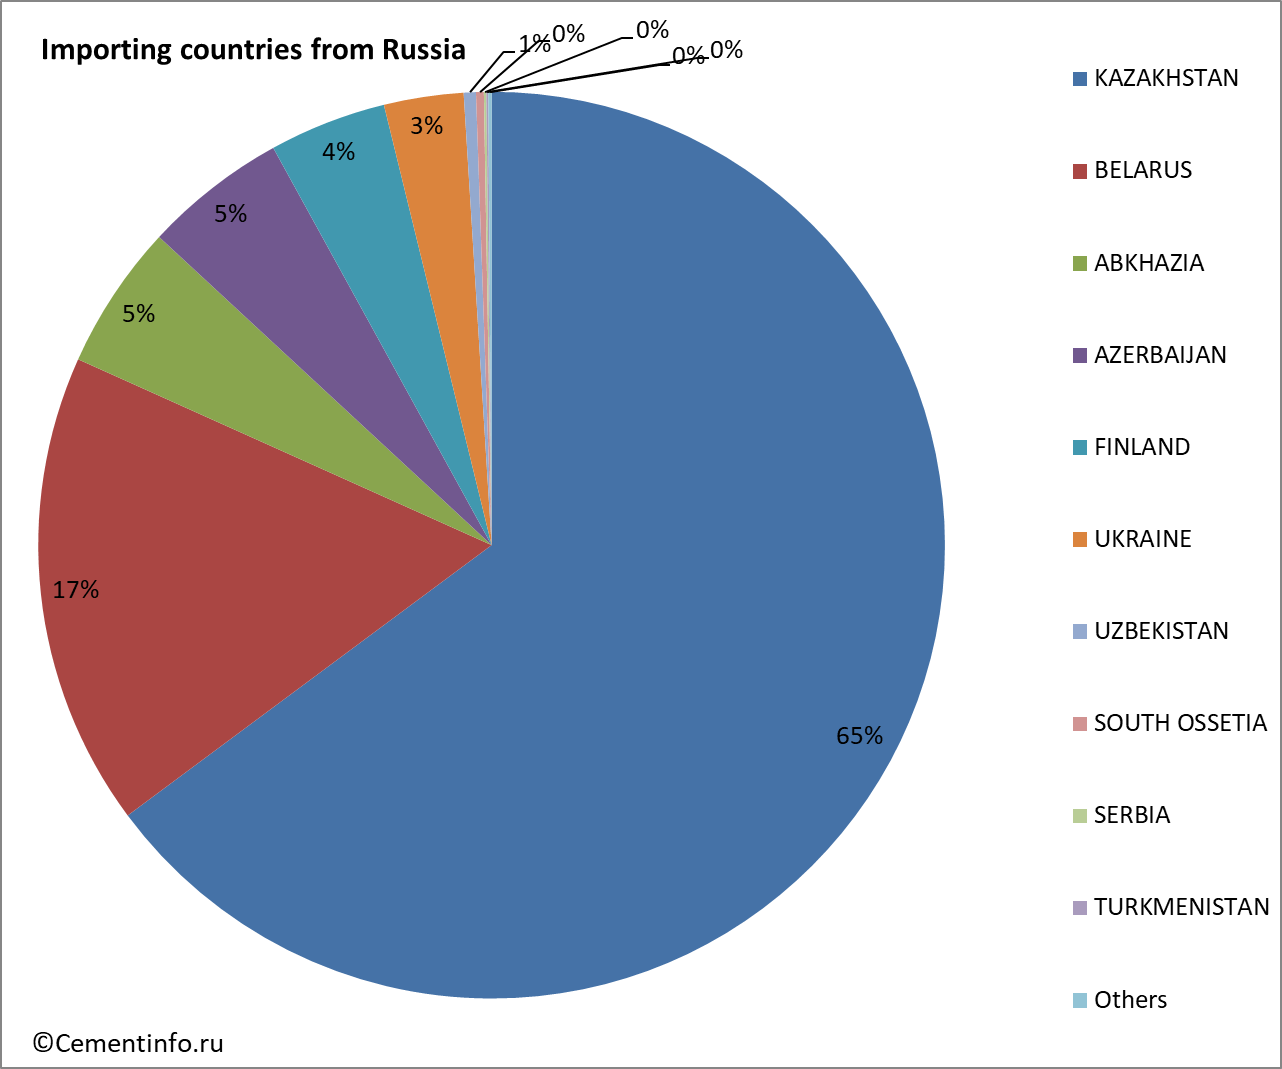
In the period January - April 2018, the main countries importers of cement from Russia were KAZAKHSTAN (64.83%) and BELARUS (16.89%)..
Tables:
- Countries – exporters of cement to Russia in January - April 2018, MT
- Countries – importers of cement from Russia in January - April 2018, MT
- Exports of cement to Russia by month, cumulative total, MT
- Imports of cement from Russia by month, cumulative total, MT
Countries – exporters of cement to Russia in January - April 2018, MT
| Exporting country to Russia, MT / year, month | 2016 | 2017 | 2018 | 2018 Total | |||
| 1 | 2 | 3 | 4 | ||||
| BELARUS | 1412848 | 1330217 | 44843 | 47552 | 72157 | 39861 | 204413 |
| KAZAKHSTAN | 208723 | 313825 | 10232 | 8836 | 16213 | 10734 | 46015 |
| TURKEY | 69381 | 143801 | 13515 | 730 | 5702 | 11250 | 31197 |
| CHINA | 55665 | 59556 | 4737 | 4673 | 2660 | 4733 | 16802 |
| IRAN | 43246 | 88368 | 3000 | 4790 | 4805 | 12595 | |
| GERMANY | 41752 | 37159 | 3047 | 2593 | 3125 | 2244 | 11009 |
| FRANCE | 24048 | 24737 | 990 | 1371 | 1438 | 1300 | 5098 |
| AUSTRIA | 11585 | 13664 | 738 | 1007 | 1499 | 950 | 4194 |
| GREECE | 9784 | 12181 | 905 | 1314 | 1064 | 886 | 4168 |
| POLAND | 10851 | 8443 | 703 | 571 | 609 | 777 | 2660 |
| SLOVENIA | 14009 | 13355 | 463 | 772 | 352 | 920 | 2507 |
| SLOVAKIA | 3587 | 4214 | 681 | 576 | 288 | 534 | 2079 |
| SPAIN | 2515 | 5157 | 110 | 880 | 767 | 213 | 1969 |
| CZECH REPUBLIC | 804 | 1434 | 204 | 460 | 595 | 409 | 1668 |
| UNITED KINGDOM | 7670 | 10190 | 206 | 128 | 320 | 636 | 1290 |
| NETHERLANDS | 1843 | 2359 | 103 | 167 | 422 | 313 | 1005 |
| UKRAINE | 68 | 1634 | 73 | 118 | 319 | 235 | 744 |
| USA | 3331 | 2450 | 43 | 246 | 160 | 228 | 677 |
| REPUBLIC OF KOREA | 5390 | 1563 | 60 | 100 | 360 | 520 | |
| INDIA | 1129 | 472 | 472 | ||||
| FINLAND | 1461 | 1555 | 141 | 63 | 143 | 116 | 463 |
| HUNGARY | 600 | 861 | 60 | 60 | 200 | 77 | 397 |
| LATVIA | 30825 | 727 | 132 | 15 | 202 | 349 | |
| ITALY | 310 | 1416 | 26 | 20 | 49 | 248 | 343 |
| THAILAND | 1481 | 1167 | 73 | 73 | 87 | 233 | |
| CROATIA | 21 | 280 | 40 | 20 | 40 | 80 | 180 |
| LITHUANIA | 57051 | 61 | 51 | 20 | 20 | 31 | 122 |
| South Africa | 40 | 25 | 20 | 40 | 85 | ||
| SWEDEN | 8196 | 124 | 17 | 19 | 35 | 71 | |
| SERBIA | 726 | 66 | 66 | ||||
| IRELAND | 180 | 420 | 45 | 45 | |||
| SWITZERLAND | 120 | 20 | 20 | ||||
| TAIWAN | 18 | ||||||
| ESTONIA | 96 | 11 | |||||
| UNITED ARAB EMIRATES | 58 | ||||||
| NORWAY | 6500 | ||||||
| BELGIUM | 26 | ||||||
| SAUDI ARABIA | 32 | ||||||
| EGYPT | 20993 | 20943 | |||||
| EUROPEAN UNION | 15 | ||||||
| MALAYSIA | 43 | ||||||
| JAPAN | 60 | 16 | |||||
| Total | 2055025 | 2103944 | 85716 | 72466 | 113262 | 82013 | 353456 |
 |
Countries – importers of cement from Russia in January - April 2018, MT
| Exports from Russia (breakdown by importing countries), MT | 2016 | 2017 | 2018 | 2018 Total | |||
| 1 | 2 | 3 | 4 | ||||
| KAZAKHSTAN | 562265 | 709374 | 20432 | 27288 | 32863 | 45606 | 126190 |
| BELARUS | 254965 | 270950 | 5170 | 7315 | 19296 | 1102 | 32882 |
| ABKHAZIA | 83747 | 38502 | 2857 | 2077 | 2483 | 2654 | 10071 |
| AZERBAIJAN | 19545 | 26103 | 2483 | 1388 | 2388 | 3676 | 9935 |
| FINLAND | 83916 | 56734 | 3017 | 664 | 1301 | 3154 | 8136 |
| UKRAINE | 16588 | 15859 | 920 | 901 | 1578 | 2122 | 5521 |
| UZBEKISTAN | 972 | 3458 | 248 | 254 | 120 | 220 | 842 |
| SOUTH OSSETIA | 2892 | 2146 | 47 | 155 | 163 | 179 | 542 |
| SERBIA | 186 | 540 | 104 | 62 | 166 | ||
| TURKMENISTAN | 4451 | 9205 | 134 | 134 | |||
| ESTONIA | 73 | 218 | 66 | 12 | 14 | 92 | |
| LITHUANIA | 62 | 125 | 62 | 62 | |||
| LATVIA | 5226 | 6456 | 33 | 33 | |||
| TAJIKISTAN | 70 | 136 | 14 | 14 | 28 | ||
| ARMENIA | 57 | 240 | 13 | 13 | |||
| KOREA (DPRK) | 483 | ||||||
| MOLDOVA | 20 | ||||||
| UNITED KINGDOM | 22 | ||||||
| MONGOLIA | 334 | ||||||
| KYRGYZSTAN | 1820 | 489 | |||||
| ALBANIA | 10 | ||||||
| FAROE ISLANDS | 70 | 402 | |||||
| AUSTRIA | 40 | ||||||
| AFGHANISTAN | 17 | ||||||
| NORWAY | 54 | ||||||
| NETHERLANDS | 11 | ||||||
| Total | 1037792 | 1141038 | 35321 | 40108 | 60385 | 58835 | 194649 |
 |
Exports of cement to Russia by month, cumulative total, MT
| Exports by Month, cumulative totals, MT | 2016 | 2017 | 2018 |
| jan | 37859 | 33081 | 35321 |
| feb | 85860 | 77258 | 75429 |
| mar | 152888 | 148645 | 135814 |
| apr | 238730 | 225302 | 194649 |
| may | 344949 | 329519 | |
| jun | 469054 | 476575 | |
| jul | 591740 | 631137 | |
| aug | 702902 | 786776 | |
| sep | 818872 | 916025 | |
| oct | 920582 | 1021905 | |
| nov | 991255 | 1086811 | |
| dec | 1037792 | 1141038 |
 |
Imports of cement from Russia by month, cumulative total, MT
| Imports by Month, cumulative totals, MT | 2016 | 2017 | 2018 |
| jan | 58857 | 85983 | 85716 |
| feb | 176889 | 190902 | 158181 |
| mar | 290794 | 315274 | 271443 |
| apr | 457719 | 495549 | 353456 |
| may | 638012 | 724954 | |
| jun | 862163 | 991863 | |
| jul | 1106863 | 1246695 | |
| aug | 1394826 | 1492515 | |
| sep | 1629175 | 1681715 | |
| oct | 1816814 | 1883002 | |
| nov | 1954962 | 2018527 | |
| dec | 2055025 | 2103944 |
 |